


***Troubleshooting Application Failures:
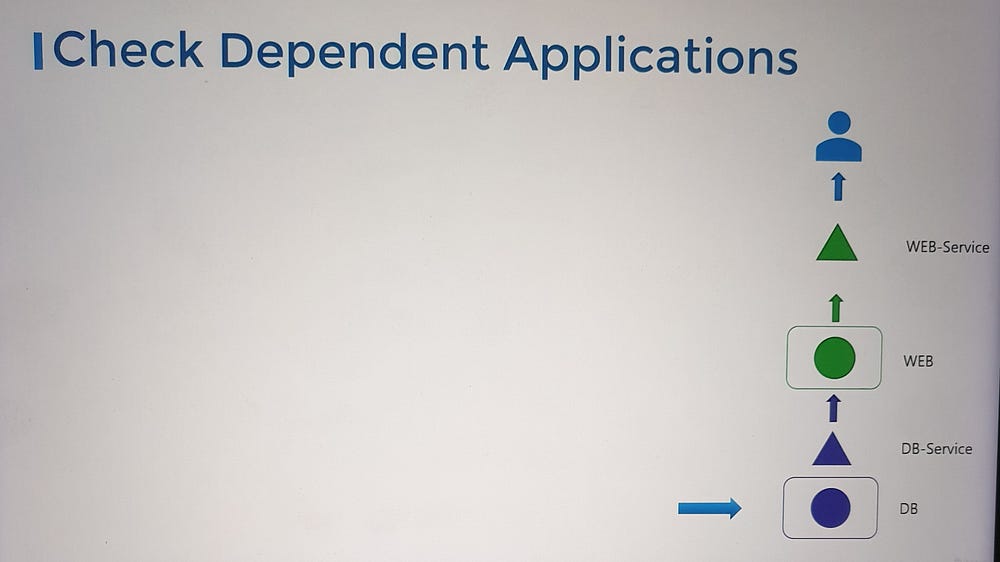
Let’s begin by examining a two-tier application consisting of a web server and a database server.
The database pod hosts the database application and serves the web server through a database service.
The web server is hosted in a web pod and serves users via a web service.
Users Report Application Access Issues
When users report issues accessing the application, start with the application’s front end:
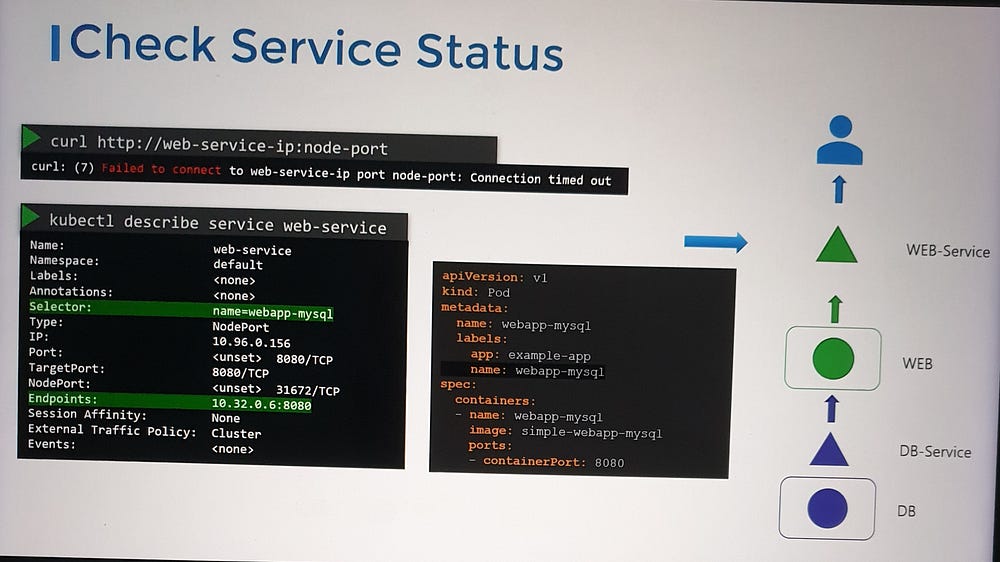
- Check Application Accessibility
— If it’s a web application, verify that the web server is accessible. Use tools like cURL to test connectivity on the node port’s IP.

2. Inspect the Web Service
— Confirm that the service has discovered the endpoints for the web pod.
— If no endpoints are discovered, verify the service-to-pod mapping:
Compare the selectors configured in the service with those defined on the pod. Ensure they align.
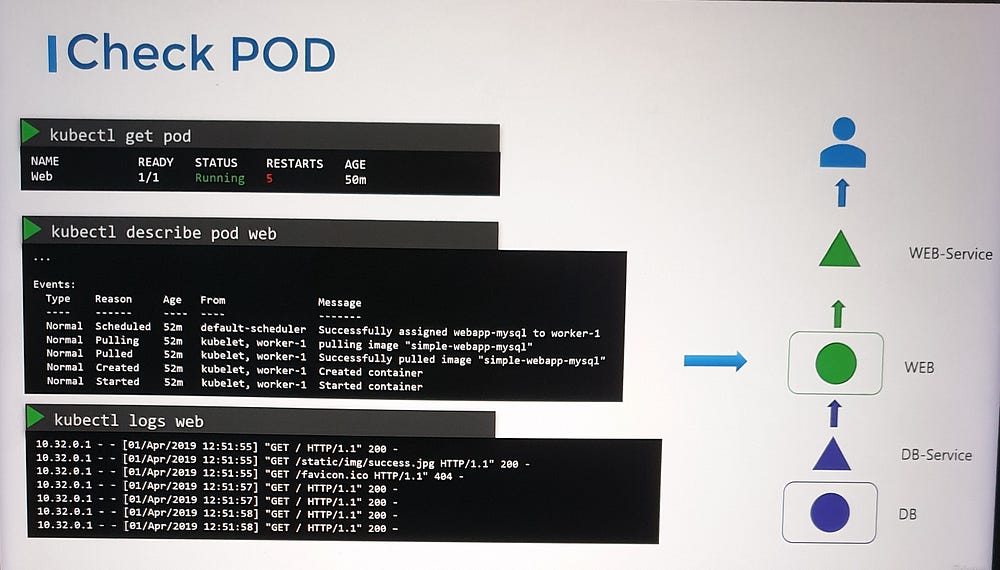
3. Examine the Web Pod
— Verify the pod is in a Running state.
— Check the pod’s status and the number of restarts. Frequent restarts might indicate application-level issues.
— Use the kubectl describe command to review events associated with the pod.
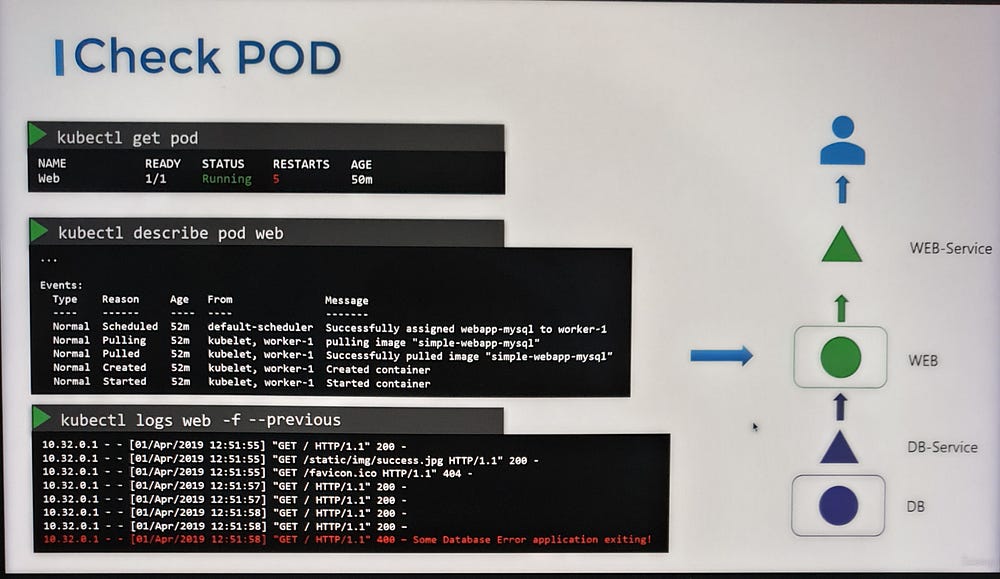
— Analyze application logs with the kubectl logs command. If the pod is restarting frequently, use the --previous option to inspect logs from the last instance of the container. Alternatively, use the --follow option to monitor logs in real time and wait for the application to fail again.
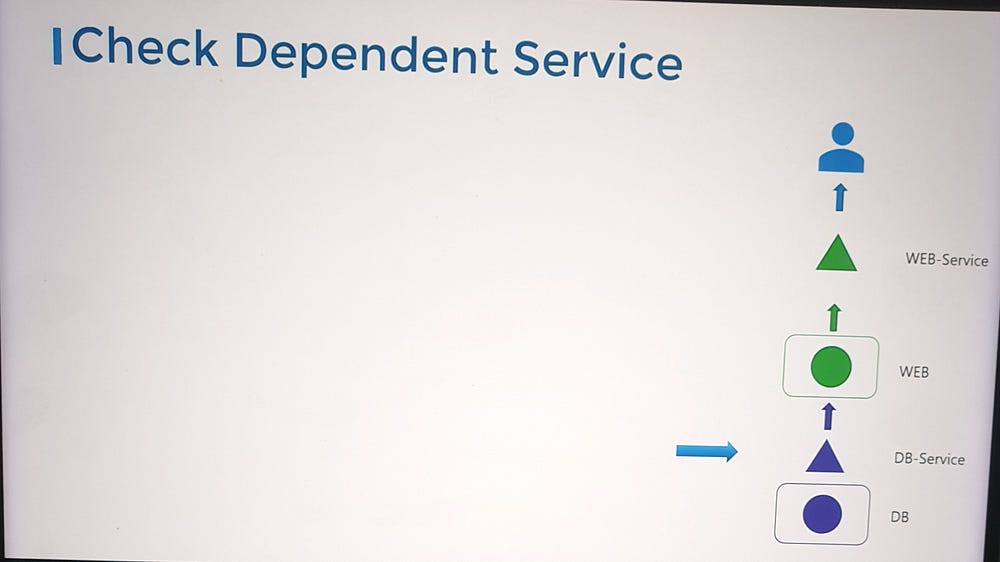
4. Validate the Database Service and Pod
— Check the status of the database service, following the same steps as the web service.
— Investigate the database pod:
Review its logs for errors or failures in the database application.
***Troubleshooting Control Plane Failures:
1. Check Cluster Node Health
Begin by verifying the status of the nodes in the cluster to ensure they are healthy and functioning as expected.
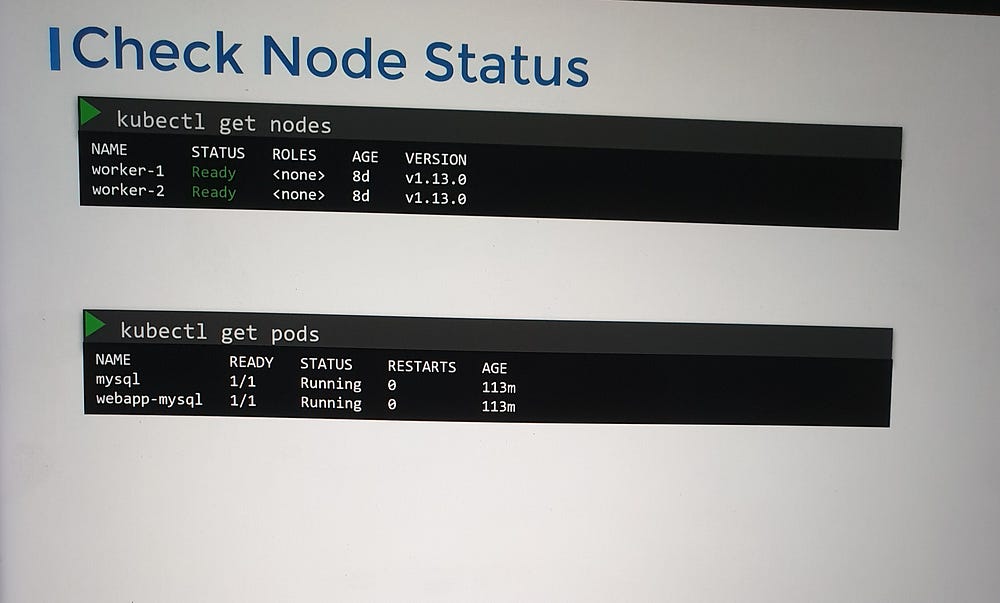
2. Inspect Pod Status
Review the status of the pods running in the cluster, particularly those associated with control plane components:
- For clusters deployed using Kubeadm, ensure that the pods in the
kube-systemnamespace are running.

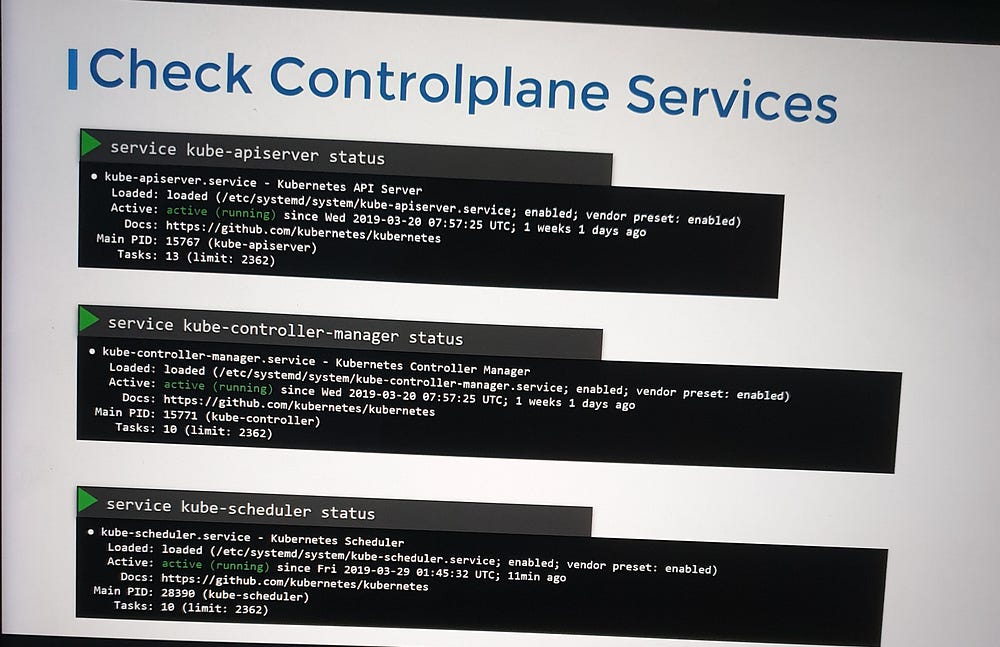
- For control plane components deployed as services, check the status of the following services on the relevant nodes:
Master nodes:
kube-apiserverkube-controller-managerkube-scheduler
Worker nodes:
kubeletkube-proxy

3. Review Control Plane Component Logs
Logs provide valuable insights into issues affecting control plane components. Depending on the deployment method, the approach to accessing logs will vary:
Kubeadm Deployments:
Use thekubectl logscommand to view logs from the pods hosting the control plane components in thekube-systemnamespace.Native Service Deployments:
If control plane components are configured as native services on master nodes, use the host system’s logging solution to access the logs. For instance:Use the
journalctlutility to view logs for services such askube-apiserver.

***Troubleshooting Worker Node Failures:
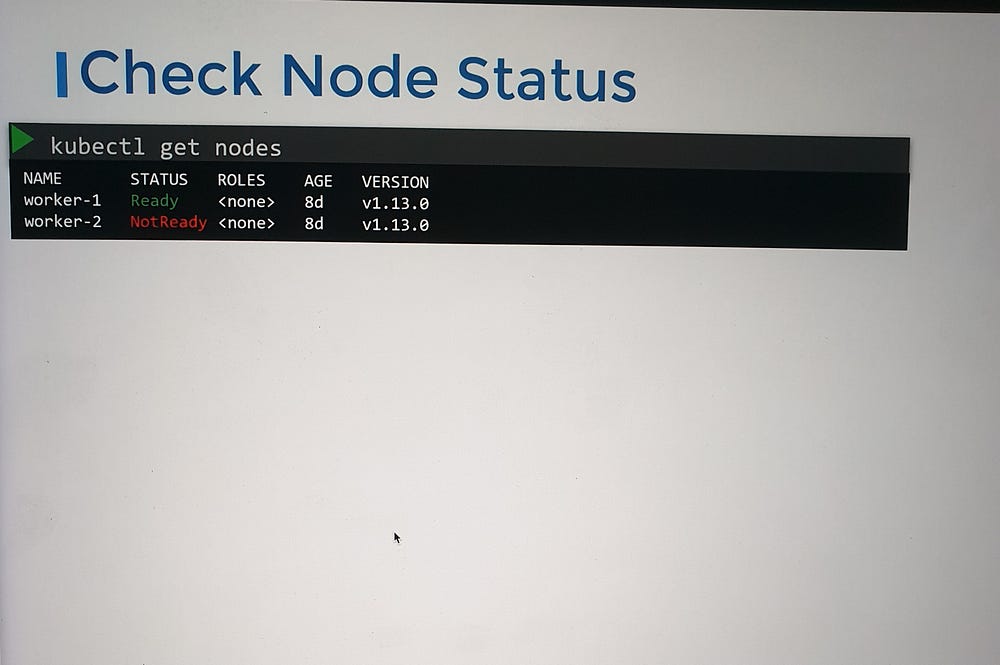
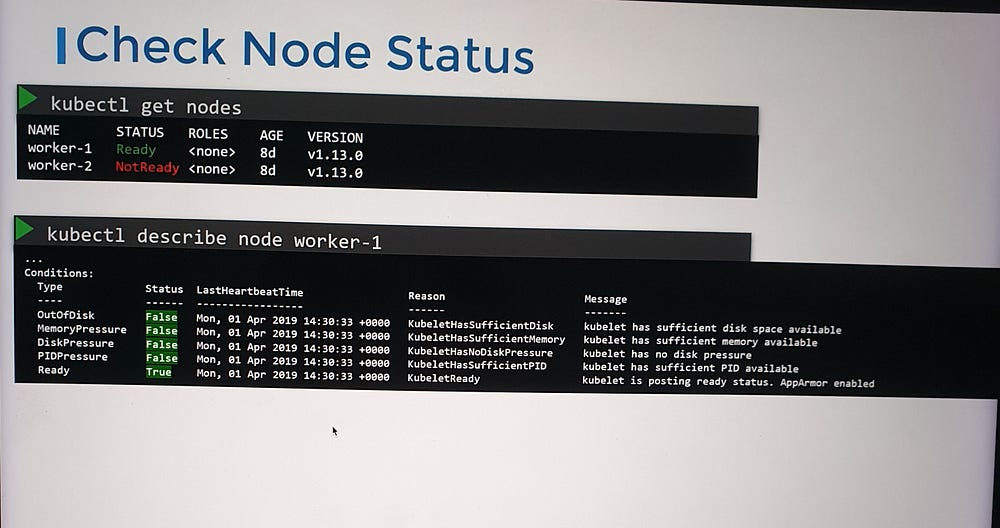
1. Check Node Status
Start by reviewing the status of the nodes in the cluster:
Determine if the nodes are reported as Ready or Not Ready.
For nodes marked as Not Ready, use the command:
kubectl describe node <node-name>
— -This provides detailed information about the node’s conditions, which can help identify potential causes of failure.
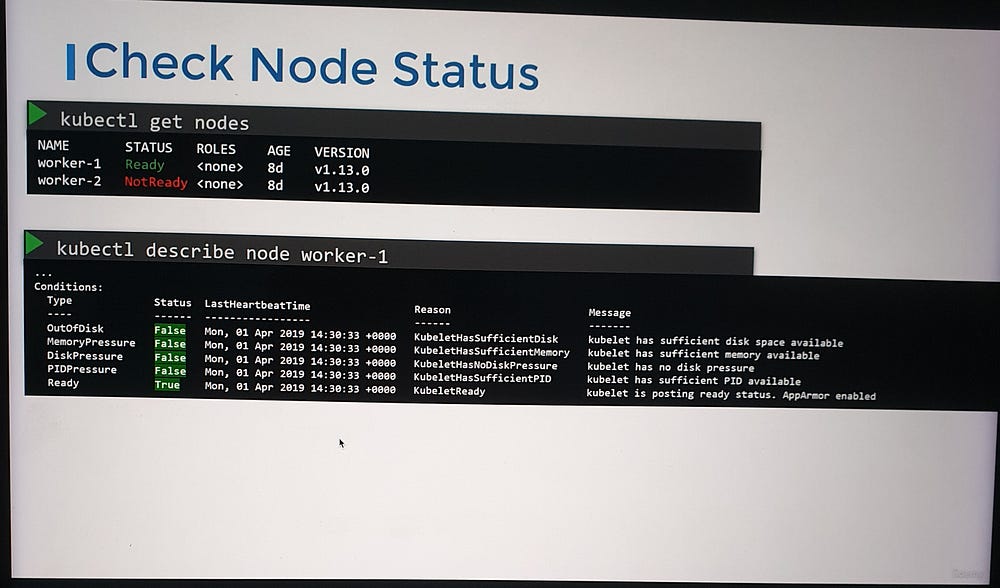
2. Analyze Node Conditions
Each node has a set of conditions that indicate its health. These conditions are marked as True, False, or Unknown, depending on the status. Common conditions to monitor include:
OutOfDisk: Indicates insufficient disk space on the node.
MemoryPressure: Set to
Truewhen the node is experiencing high memory usage.DiskPressure: Set to
Truewhen disk capacity is critically low.PIDPressure: Set to
Truewhen there are too many running processes on the node.Ready: Indicates that the node is healthy and operational when set to
True.
If a node stops communicating with the control plane (e.g., due to a crash), its status may appear as Unknown. This could signal a potential node failure.
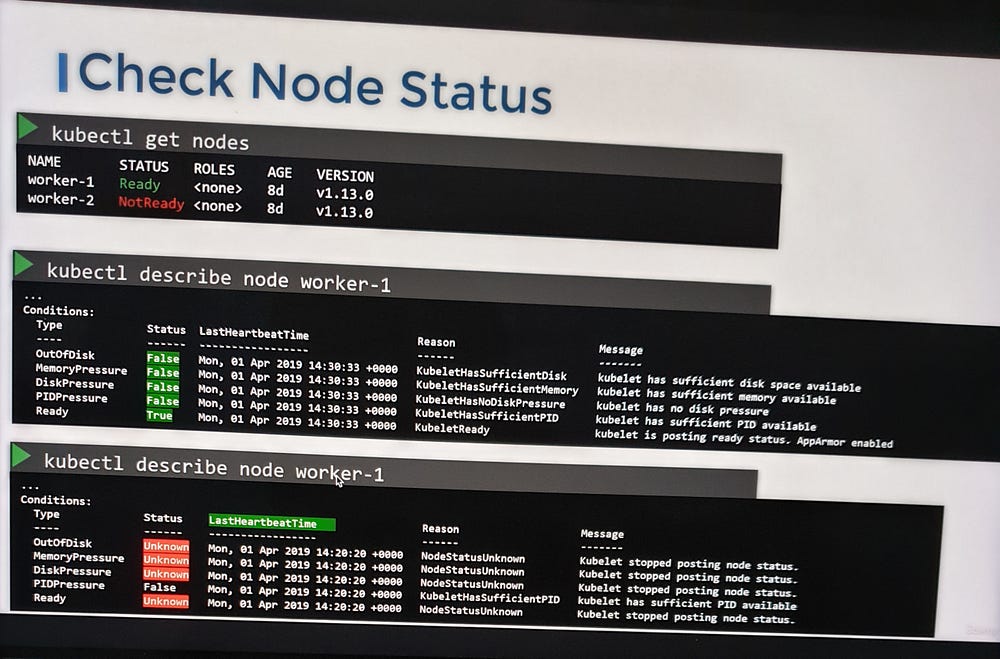
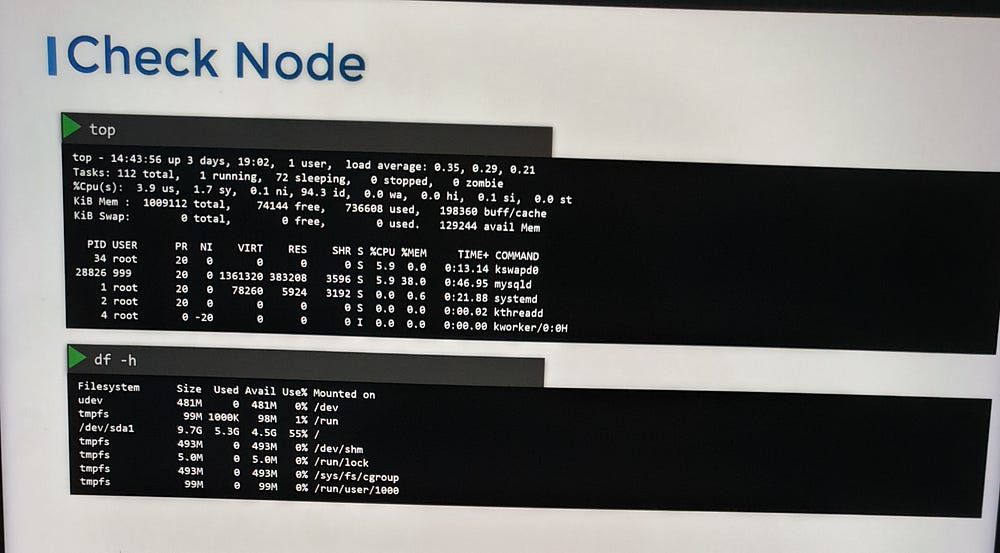
3. Investigate Node Health
Check the last heartbeat time field to identify when the node stopped communicating.
Verify whether the node is still online or has crashed. If the node has crashed, restart it.
Inspect the node’s CPU, memory, and disk resources to ensure they meet the cluster’s requirements.
4. Check kubelet Status and Logs
Confirm that the kubelet service is running on the worker node.
Review kubelet logs for any errors or warnings that might explain the issue:
journalctl -u kubelet

5. Validate kubelet Certificates
Ensure the kubelet certificates are:
Not expired.
Assigned to the correct group.
Issued by the appropriate Certificate Authority (CA).

***Network Troubleshooting:
Network Plugin in kubernetes.
1. Weave Net:
kubectl apply -f https://github.com/weaveworks/weave/releases/download/v2.8.1/weave-daemonset-k8s.yaml
2. Flannel :
kubectl apply -f https://raw.githubusercontent.com/coreos/flannel/2140ac876ef134e0ed5af15c65e414cf26827915/Documentation/kube-flannel.yml
Note: As of now flannel does not support kubernetes network policies.
3. Calico :
curl https://raw.githubusercontent.com/projectcalico/calico/v3.25.0/manifests/calico.yaml -O
Apply the manifest using the following command.
kubectl apply -f calico.yaml
Calico is said to have most advanced cni network plugin.
Note: If there are multiple CNI configuration files in the directory, the kubelet uses the configuration file that comes first by name in lexicographic order.
DNS in Kubernetes:
Kubernetes uses CoreDNS. CoreDNS is a flexible, extensible DNS server that can serve as the Kubernetes cluster DNS.
Memory and Pods
In large scale Kubernetes clusters, CoreDNS’s memory usage is predominantly affected by the number of Pods and Services in the cluster. Other factors include the size of the filled DNS answer cache, and the rate of queries received (QPS) per CoreDNS instance.
Kubernetes resources for coreDNS are:
a service account named coredns*,*
cluster-roles named coredns and kube-dns
clusterrolebindings named coredns and kube-dns*,*
a deployment named coredns*,*
a configmap named coredns and a
service named kube-dns*.*
While analyzing the coreDNS deployment you can see that the the Corefile plugin consists of important configuration which is defined as a configmap.
Port 53 is used for for DNS resolution.
  kubernetes cluster.local in-addr.arpa ip6.arpa {
       pods insecure
       fallthrough in-addr.arpa ip6.arpa
       ttl 30
    }
This is the backend to k8s for cluster.local and reverse domains.
proxy . /etc/resolv.conf
Forward out of cluster domains directly to right authoritative DNS server.
Troubleshooting issues related to coreDNS
1. If you find CoreDNS pods in pending state first check network plugin is installed.
2. coredns pods have CrashLoopBackOff or Error state
If you have nodes that are running SELinux with an older version of Docker you might experience a scenario where the coredns pods are not starting. To solve that you can try one of the following options:
a)Upgrade to a newer version of Docker.
b)Disable SELinux.
c)Modify the coredns deployment to set allowPrivilegeEscalation to true:
kubectl -n kube-system get deployment coredns -o yaml | \
  sed 's/allowPrivilegeEscalation: false/allowPrivilegeEscalation: true/g' | \
  kubectl apply -f -
d)Another cause for CoreDNS to have CrashLoopBackOff is when a CoreDNS Pod deployed in Kubernetes detects a loop.
There are many ways to work around this issue, some are listed here:
Add the following to your kubelet config yaml: resolvConf: <path-to-your-real-resolv-conf-file> This flag tells kubelet to pass an alternate resolv.conf to Pods. For systems using systemd-resolved, /run/systemd/resolve/resolv.conf is typically the location of the “real” resolv.conf, although this can be different depending on your distribution.
Disable the local DNS cache on host nodes, and restore /etc/resolv.conf to the original.
A quick fix is to edit your Corefile, replacing forward . /etc/resolv.conf with the IP address of your upstream DNS, for example forward . 8.8.8.8. But this only fixes the issue for CoreDNS, kubelet will continue to forward the invalid resolv.conf to all default dnsPolicy Pods, leaving them unable to resolve DNS.
3. If CoreDNS pods and the kube-dns service is working fine, check the kube-dns service has valid endpoints.
kubectl -n kube-system get ep kube-dns
If there are no endpoints for the service, inspect the service and make sure it uses the correct selectors and ports.
Kube-Proxy:
kube-proxy is a network proxy that runs on each node in the cluster. kube-proxy maintains network rules on nodes. These network rules allow network communication to the Pods from network sessions inside or outside of the cluster.
In a cluster configured with kubeadm, you can find kube-proxy as a daemonset.
kubeproxy is responsible for watching services and endpoint associated with each service. When the client is going to connect to the service using the virtual IP the kubeproxy is responsible for sending traffic to actual pods.
If you run a kubectl describe ds kube-proxy -n kube-system you can see that the kube-proxy binary runs with following command inside the kube-proxy container.
Command:
      /usr/local/bin/kube-proxy
      --config=/var/lib/kube-proxy/config.conf
      --hostname-override=$(NODE_NAME)
So it fetches the configuration from a configuration file ie, /var/lib/kube-proxy/config.conf and we can override the hostname with the node name of at which the pod is running.
In the config file we define the clusterCIDR, kubeproxy mode, ipvs, iptables, bindaddress, kube-config etc.
Troubleshooting issues related to kube-proxy:
1. Check kube-proxy pod in the kube-system namespace is running.
2. Check kube-proxy logs.
3. Check configmap is correctly defined and the config file for running kube-proxy binary is correct.
4. kube-config is defined in the config map.
5. check kube-proxy is running inside the container
# netstat -plan | grep kube-proxy
tcp        0      0 0.0.0.0:30081           0.0.0.0:*               LISTEN      1/kube-proxy
tcp        0      0 127.0.0.1:10249         0.0.0.0:*               LISTEN      1/kube-proxy
tcp        0      0 172.17.0.12:33706       172.17.0.12:6443        ESTABLISHED 1/kube-proxy
tcp6       0      0 :::10256                :::*                    LISTEN      1/kube-proxy
Final Thoughts:
Effective Kubernetes troubleshooting involves accurately identifying the root cause, implementing the necessary fixes to restore functionality, and thoroughly verifying the resolution. Key insights gained from the process include identifying and addressing configuration gaps, enhancing monitoring systems, and adopting preventive measures to mitigate similar issues in the future. This iterative approach not only resolves immediate challenges but also strengthens the overall reliability and resilience of Kubernetes environments.