Monitoring Project
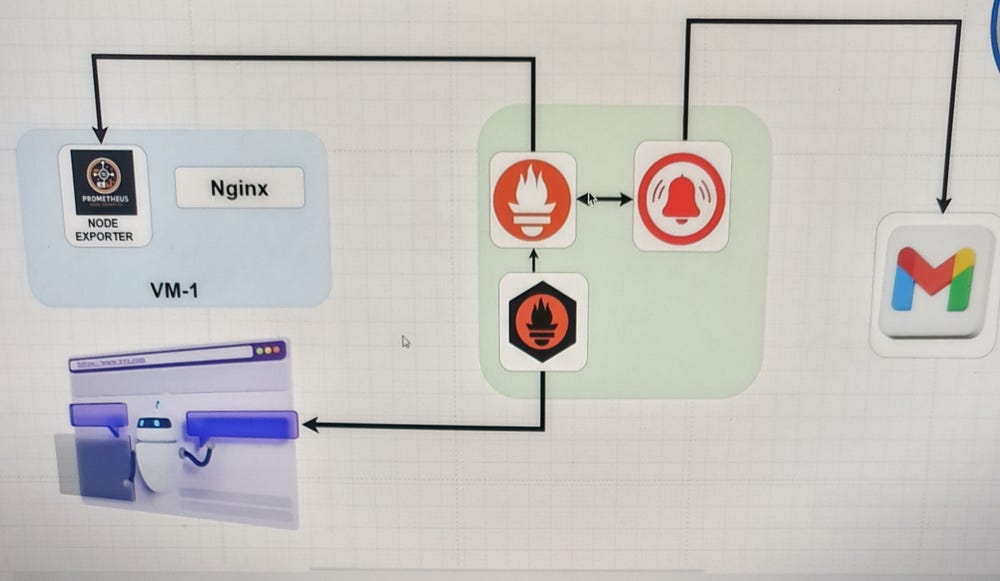
The image illustrates a monitoring and alerting architecture that integrates
Prometheus is configured to scrape these metrics and evaluate alerting rules. If any alerts are triggered, Prometheus forwards them to Alertmanager. Alertmanager then processes these alerts and sends notifications via email to the configured Gmail account.
Moreover, the setup includes a blackbox exporter (shown in the bottom left), which probes and monitors web endpoints, feeding the results back to Prometheus. Thus, this integrated setup ensures comprehensive monitoring and timely alerts for system performance and web service availability.
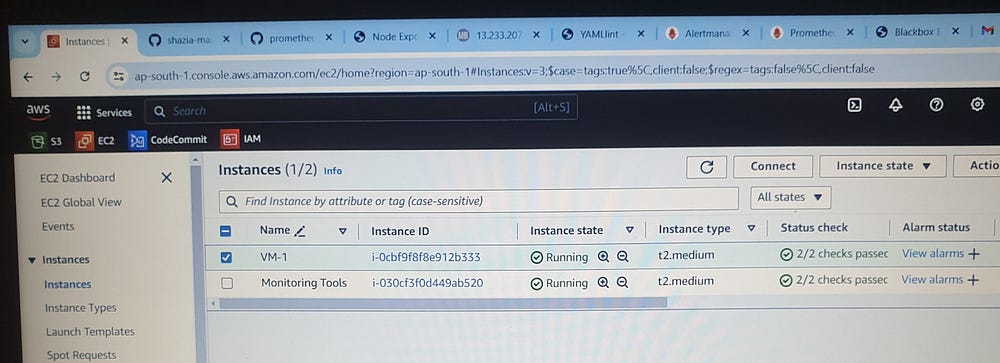
Two EC2 instances, VM-1 and Monitoring Tools, of instance type t2.medium, have been launched.
Steps for Downloading, Extracting, and Starting Prometheus, Node Exporter, Blackbox Exporter, and Alertmanager
Prerequisites
Ensure you have
wgetandtarinstalled on both VMs.Ensure you have appropriate permissions to download, extract, and run these binaries.
Prometheus.io download
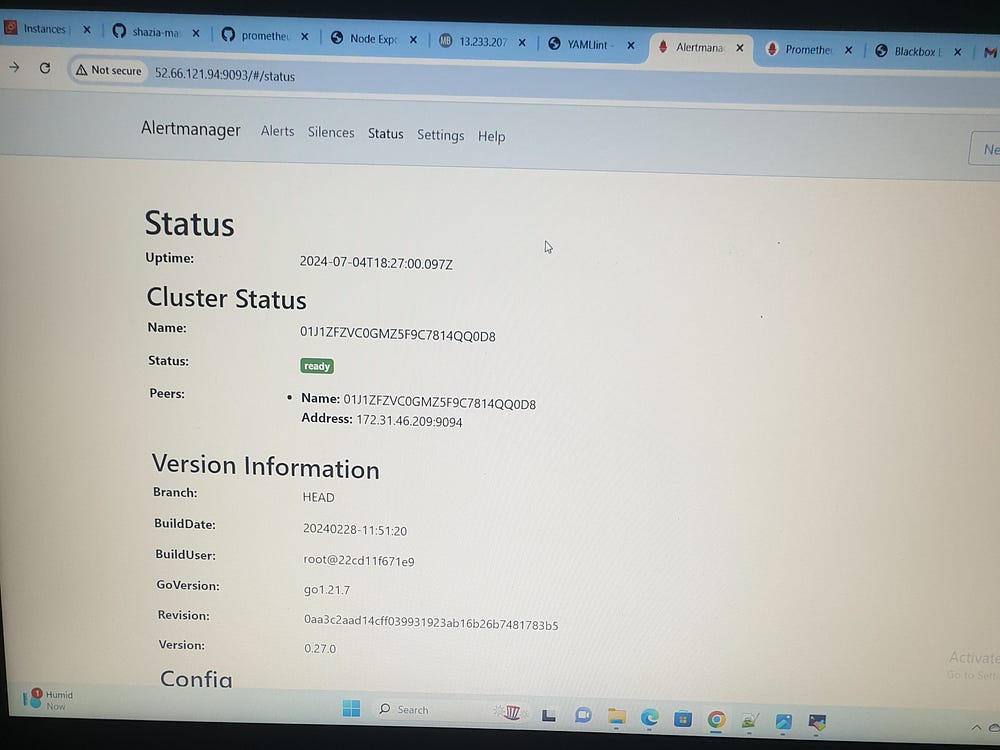
Monitoring Tools: (Prometheus, blackbox exportor, alertmanager )
Download Prometheus:wget https://github.com/prometheus/blackbox_exporter/releases/download/v0.25.0/blackbox_exporter-0.25.0.linux-amd64.tar.gz
sudo apt update
wget https://github.com/prometheus/prometheus/releases/download/v2.52.0/prometheus-2.52.0.linux-amd64.tar.gz
#extract the package
tar -xvf prometheus-2.52.0.linux-amd64.tar.gz
prometheus-2.52.0.linux-amd64
#remove tar.gz
rm prometheus-2.52.0.linux-amd64.tar.gz
#rename the file
mv prometheus-2.52.0.linux-amd64/   prometheus


#start prometheus
cd prometheus
./prometheus &
Download blackbox exporter:
sudo apt update
wget https://github.com/prometheus/blackbox_exporter/releases/download/v0.25.0/blackbox_exporter-0.25.0.linux-amd64.tar.gz
#extract the package
tar -xvfz blackbox_exporter-0.25.0.linux-amd64.tar.gz
blackbox_exporter-0.25.0.linux-amd64
#remove tar.gz
rm blackbox_exporter-0.25.0.linux-amd64.tar.gz
#rename the file
mv blackbox_exporter-0.25.0.linux-amd64/ blackbox_exporter


#start blackbox_exporter
cd blackbox_exporter
./blackbox_exporter &
Download alertmanager:
sudo apt update
wget https://github.com/prometheus/alertmanager/releases/download/v0.27.0/alertmanager-0.27.0.linux-amd64.tar.gz
#extract this package
tar -xvfz alertmanager-0.27.0.linux-amd64.tar.gz
alertmanager-0.27.0.linux-amd64
#remove tar.gz
rm alertmanager-0.27.0.linux-amd64.tar.gz
#rename the file
mv alertmanager-0.27.0.linux-amd64/  alertmanager


#start alertmanager
cd alertmanager
./alertmanager &
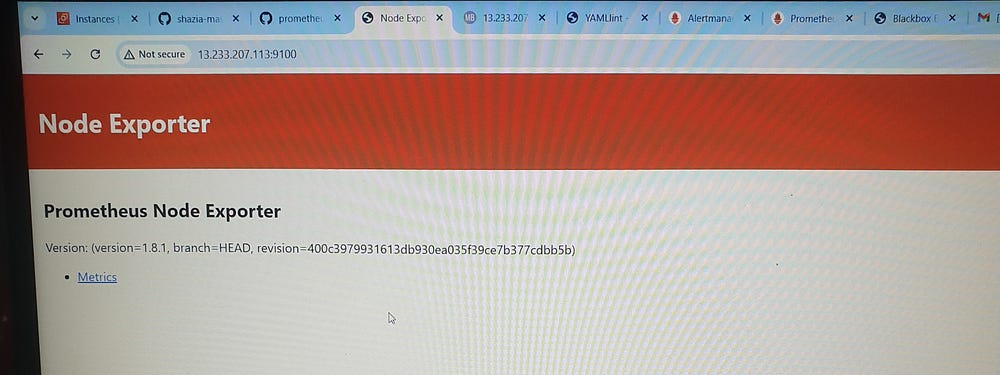
VM-1 (Boardgame, node exporter):
sudo apt update
wget https://github.com/prometheus/node_exporter/releases/download/v1.8.1/node_exporter-1.8.1.linux-amd64.tar.gz
#extract this package
tar -xvfz node_exporter-1.8.1.linux-amd64.tar.gz
#remove tar.gz
rm node_exporter-1.8.1.linux-amd64.tar.gz
#rename the file
mv node_exporter-1.8.1.linux-amd64/  node_exporter

# start node_exporter
cd node_exporter
./node_exporter &
sudo apt update
git clone https://github.com/shazia-massey/Boardgame.git
cd Boardgame/
sudo apt install openjdk-17-jre-headless -y
sudo apt install maven -y
mvn package
cd target/
java -jar database_service_project-0.0.2.jar

ip:8080
Prometheus and Alertmanager Configuration:
prometheus Configuration ( prometheus.yml)
Global Configuration:
global:
  scrape_interval: 15s                # Set the scrape interval to every 15 seconds. Default is every 1 minute.
  evaluation_interval: 15s            # Evaluate rules every 15 seconds. The default is every 1 minute.
  # scrape_timeout is set to the global default (10s).
Alertmanager configuration:
alerting:
  alertmanagers:
    - static_configs:
        - targets:
          - 'localhost:9093'          # Alertmanager endpoint
Rule Files:
rule_files:
   - "alert_rules.yml"                # Path to alert rules file
  # - "second_rules.yml"              # Additional rule files can be added here
Scrape Configuration:
Prometheus
scrape_configs:
  - job_name: "prometheus"            # Job name for Prometheus

    # metrics_path defaults to '/metrics'
    # scheme defaults to 'http'.

    static_configs:
      - targets: ["localhost:9090"]   # Target to scrape (Prometheus itself)
node_exporter
- job_name: node_exporter
  static_configs:
     - targets:
       - 13.233.207.113:9100
Blackbox Exporter
- job_name: blackbox
  metrics_path: /probe
  params:
    module:
   - http_2xx
  static_configs:
    - targets:
        - http://prometheus.io
        - https://prometheus.io
        - http://13.233.207.113:8080/
  relabel_configs:
    - source_labels:
        - __address__
      target_label: __param_target
    - source_labels:
        - __param_target
      target_label: instance
    - target_label: __address__
      replacement: 52.66.121.94:9115
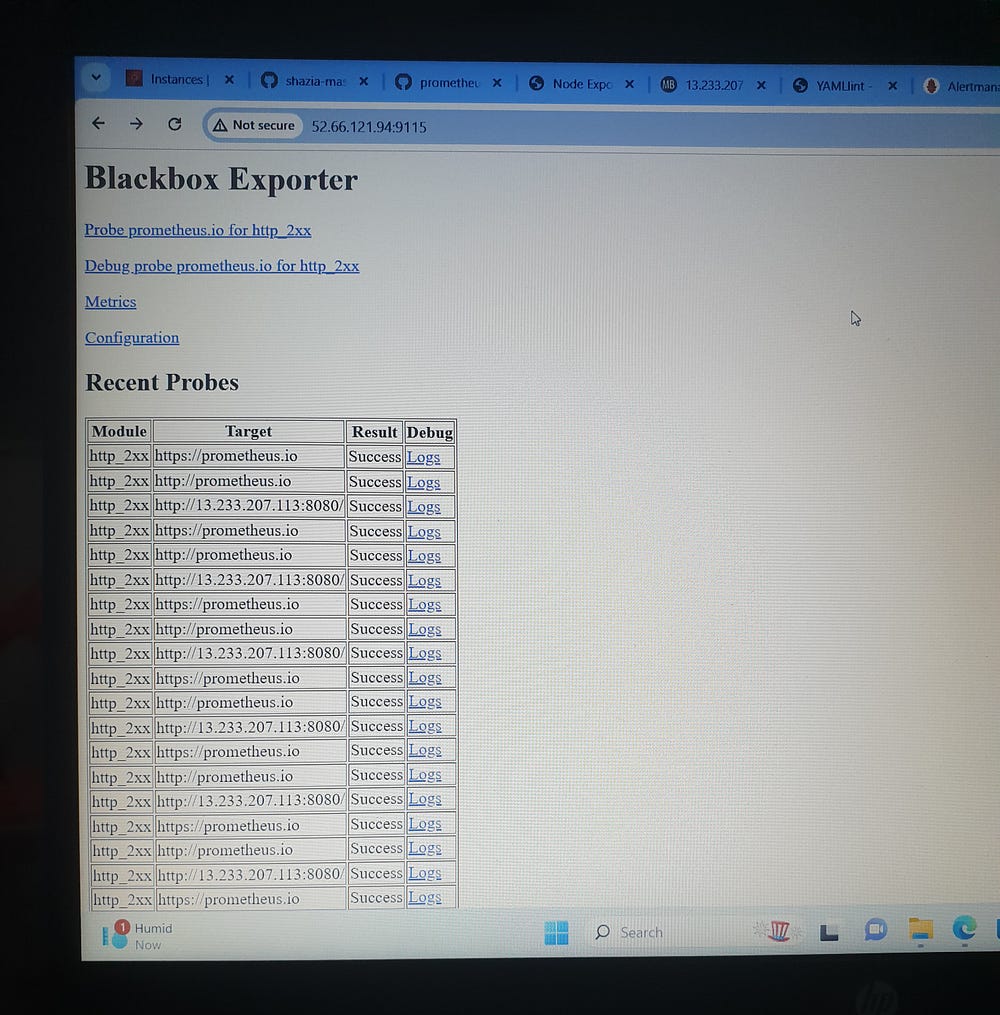
The provided YAML configuration establishes two Prometheus scrape jobs for robust monitoring. The node_exporter job targets 13.233.207.113:9100 to gather system and hardware metrics. The blackbox job probes multiple HTTP endpoints (prometheus.io, https://prometheus.io, and http://13.233.207.113:8080/) using the http_2xx module to verify successful HTTP responses. Relabel configurations are applied to adjust labels: the original target addresses are relabeled to __param_target, then to instance, and the final target address is set to 52.66.121.94:9115, where the Blackbox Exporter operates. This configuration enables Prometheus to effectively monitor both system performance and web service availability.
Alert Rules Configuration (alert_rules.yml)
Alert Rules Group
---
groups:
  - name: alert_rules
    rules:
      - alert: InstanceDown
        expr: up == 0
        for: 1m
        labels:
          severity: critical
        annotations:
          summary: Endpoint {{ $labels.instance }} down
          description: "{{ $labels.instance }} of job {{ $labels.job }} has been down for
            more than 1 minute."
      - alert: WebsiteDown
        expr: probe_success == 0
        for: 1m
        labels:
          severity: critical
        annotations:
          description: The website at {{ $labels.instance }} is down.
          summary: Website down
      - alert: HostOutOfMemory
        expr: node_memory_MemAvailable / node_memory_MemTotal * 100 < 25
        for: 5m
        labels:
          severity: warning
        annotations:
          summary: Host out of memory (instance {{ $labels.instance }})
          description: |-
            Node memory is filling up (< 25% left)
              VALUE = {{ $value }}
              LABELS: {{ $labels }}
      - alert: HostOutOfDiskSpace
        expr: (node_filesystem_avail{mountpoint="/"} * 100) /
          node_filesystem_size{mountpoint="/"} < 50
        for: 1s
        labels:
          severity: warning
        annotations:
          summary: Host out of disk space (instance {{ $labels.instance }})
          description: |-
            Disk is almost full (< 50% left)
              VALUE = {{ $value }}
              LABELS: {{ $labels }}
      - alert: HostHighCpuLoad
        expr: (sum by (instance)
          (irate(node_cpu{job="node_exporter_metrics",mode="idle"}[5m]))) > 80
        for: 5m
        labels:
          severity: warning
        annotations:
          summary: Host high CPU load (instance {{ $labels.instance }})
          description: |-
            CPU load is > 80%
              VALUE = {{ $value }}
              LABELS: {{ $labels }}
      - alert: ServiceUnavailable
        expr: up{job="node_exporter"} == 0
        for: 2m
        labels:
          severity: critical
        annotations:
          summary: Service Unavailable (instance {{ $labels.instance }})
          description: |-
            The service {{ $labels.job }} is not available
              VALUE = {{ $value }}
              LABELS: {{ $labels }}
      - alert: HighMemoryUsage
        expr: (node_memory_Active / node_memory_MemTotal) * 100 > 90
        for: 10m
        labels:
          severity: critical
        annotations:
          summary: High Memory Usage (instance {{ $labels.instance }})
          description: |-
            Memory usage is > 90%
              VALUE = {{ $value }}
              LABELS: {{ $labels }}
      - alert: FileSystemFull
        expr: (node_filesystem_avail / node_filesystem_size) * 100 < 10
        for: 5m
        labels:
          severity: critical
        annotations:
          summary: File System Almost Full (instance {{ $labels.instance }})
          description: |-
            File system has < 10% free space
              VALUE = {{ $value }}
              LABELS: {{ $labels }}
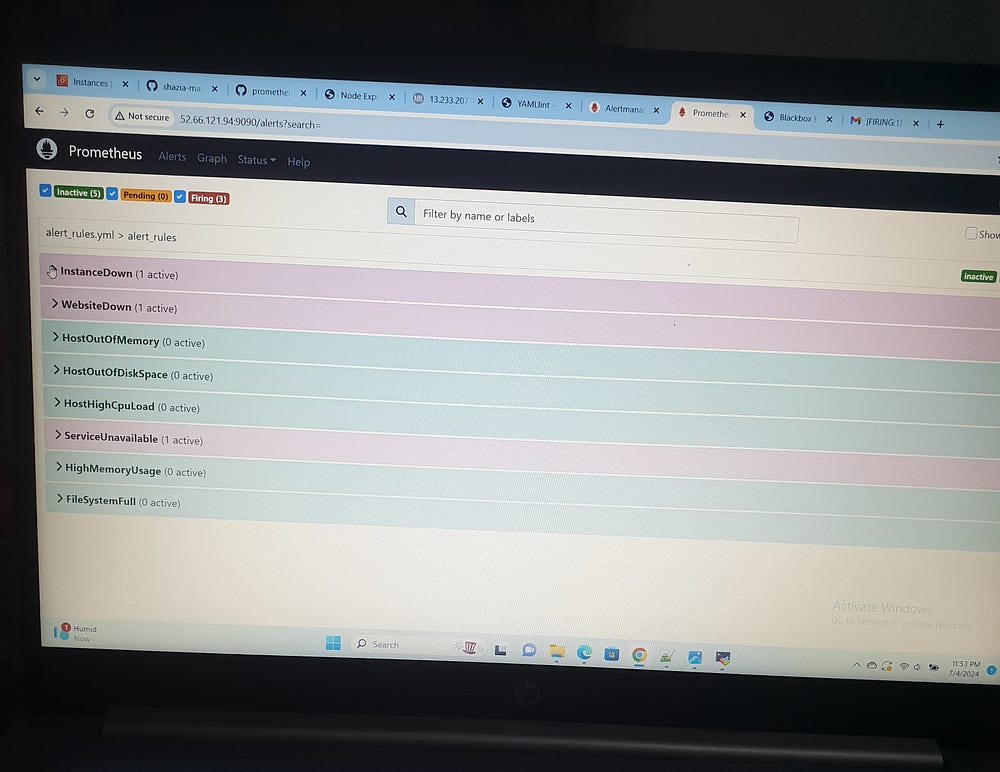
The provided YAML configuration defines a comprehensive set of Prometheus alerting rules aimed at monitoring system health. These rules are organized under the alert_rules group and include various alerts, each specified by an alert name, a Prometheus expression (expr) to trigger the alert, a duration (for) indicating how long the condition must be true before the alert is fired, labels for categorization, and annotations for additional information.
InstanceDown: This alert is triggered when a target is down (up == 0) for more than 1 minute. It is classified as critical severity and includes the instance and job labels in the description.
WebsiteDown: This alert is triggered when a website is down (probe_success == 0) for more than 1 minute, also with a critical severity, and includes the instance label in its description.
HostOutOfMemory: This alert is triggered when available memory is less than 25% of total memory for 5 minutes, with a warning severity, including the memory value and instance labels in its description.
HostOutOfDiskSpace: This alert is triggered immediately when the root filesystem has less than 50% free space. It is classified as warning severity and includes the disk value and instance labels in the description.
HostHighCpuLoad: This alert is triggered when idle CPU time is greater than 80% over 5 minutes. It is classified as warning severity and includes the CPU load value and instance labels in the description.
ServiceUnavailable: This alert is triggered when a node_exporter job is down for 2 minutes. It is classified as critical severity and includes the service value and instance labels in the description.
HighMemoryUsage: This alert is triggered when active memory usage exceeds 90% for 10 minutes, with a critical severity, including the memory usage value and instance labels in its description.
FileSystemFull: This alert is triggered when the filesystem has less than 10% free space for 5 minutes. It is classified as critical severity and includes the filesystem value and instance labels in the description.
Alertmanager Configuration (alertmanager.yml)
Routing Configuration
---
route:
  group_by:
    - alertname
  group_wait: 30s
  group_interval: 5m
  repeat_interval: 1h
  receiver: email-notifications
receivers:
  - name: email-notifications
    email_configs:
      - to: masseys.s123@gmail.com
        from: Monitoring@example.com
        smarthost: smtp.gmail.com:587
        auth_username: masseys.s123@gmail.com
        auth_identity: masseys.s123@gmail.com
        auth_password: khvu mxxp grsd hxgp
        send_resolved: true
inhibit_rules:
  - source_match:
      severity: critical
    target_match:
      severity: warning
    equal:
      - alertname
      - dev
      - instance
The provided YAML configuration sets up Alertmanager routing and notifications for Prometheus. It defines a route that groups alerts by alertname, with a group_wait time of 30 seconds, a group_interval of 5 minutes, and a repeat_interval of 1 hour. The primary receiver for these alerts is email-notifications.
The email-notifications receiver is configured to send alert emails to masseys.s123@gmail.com from Monitoring@example.com via the SMTP server at smtp.gmail.com:587. Authentication is handled using the specified username (masseys.s123@gmail.com), identity (masseys.s123@gmail.com), and password. The send_resolved parameter is set to true, ensuring notifications are sent when alerts are resolved.
Additionally, an inhibit rule is defined to prevent alerts with a severity of warning from being sent if there is already an alert with a severity of critical for the same alertname, dev, and instance labels. This configuration helps in prioritizing critical alerts and avoiding redundant notifications for related warnings.

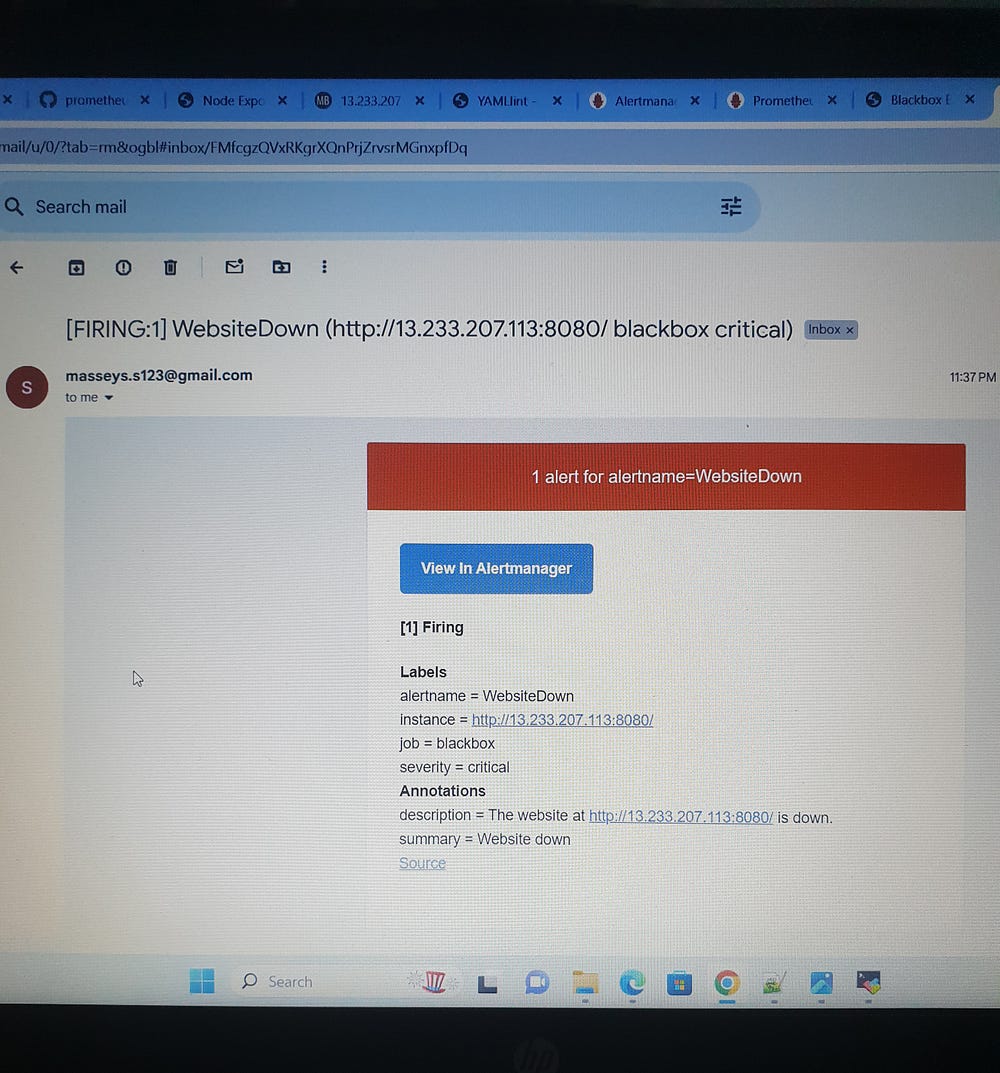
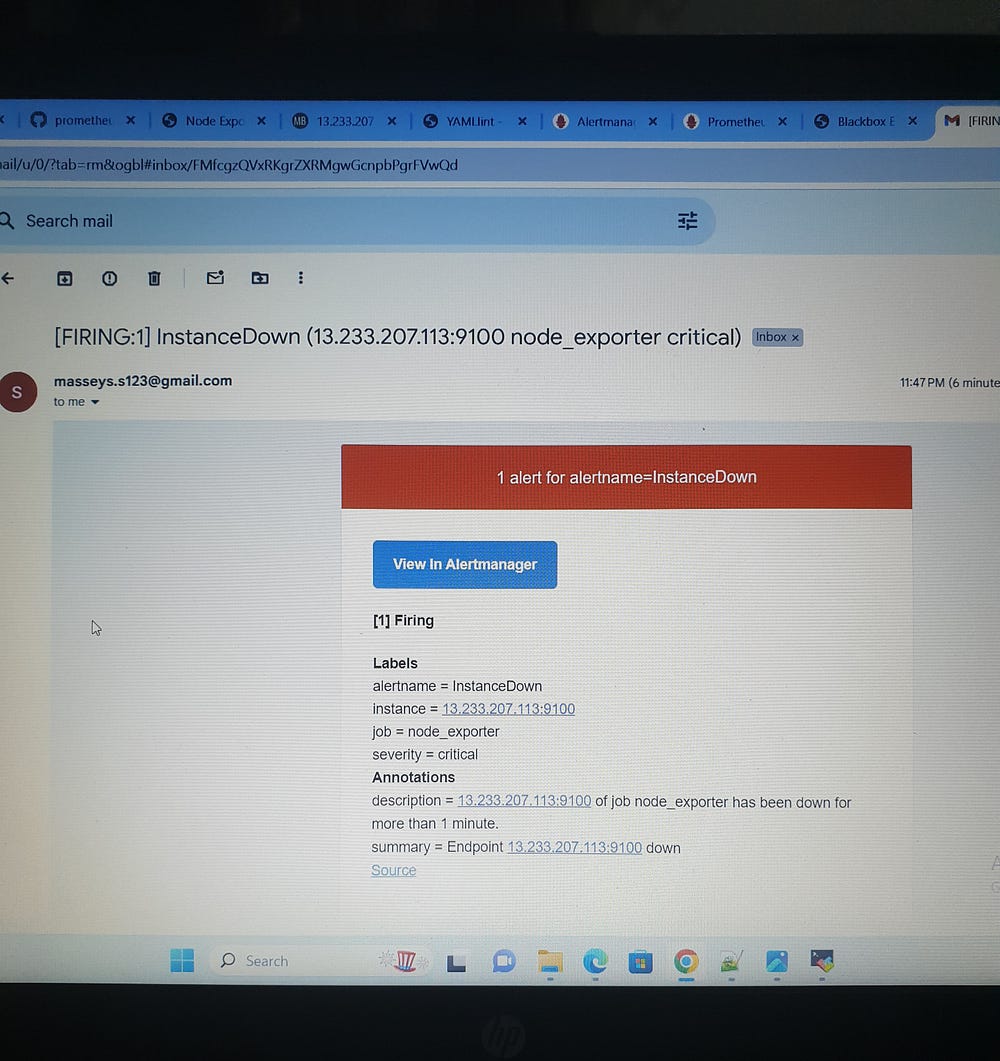
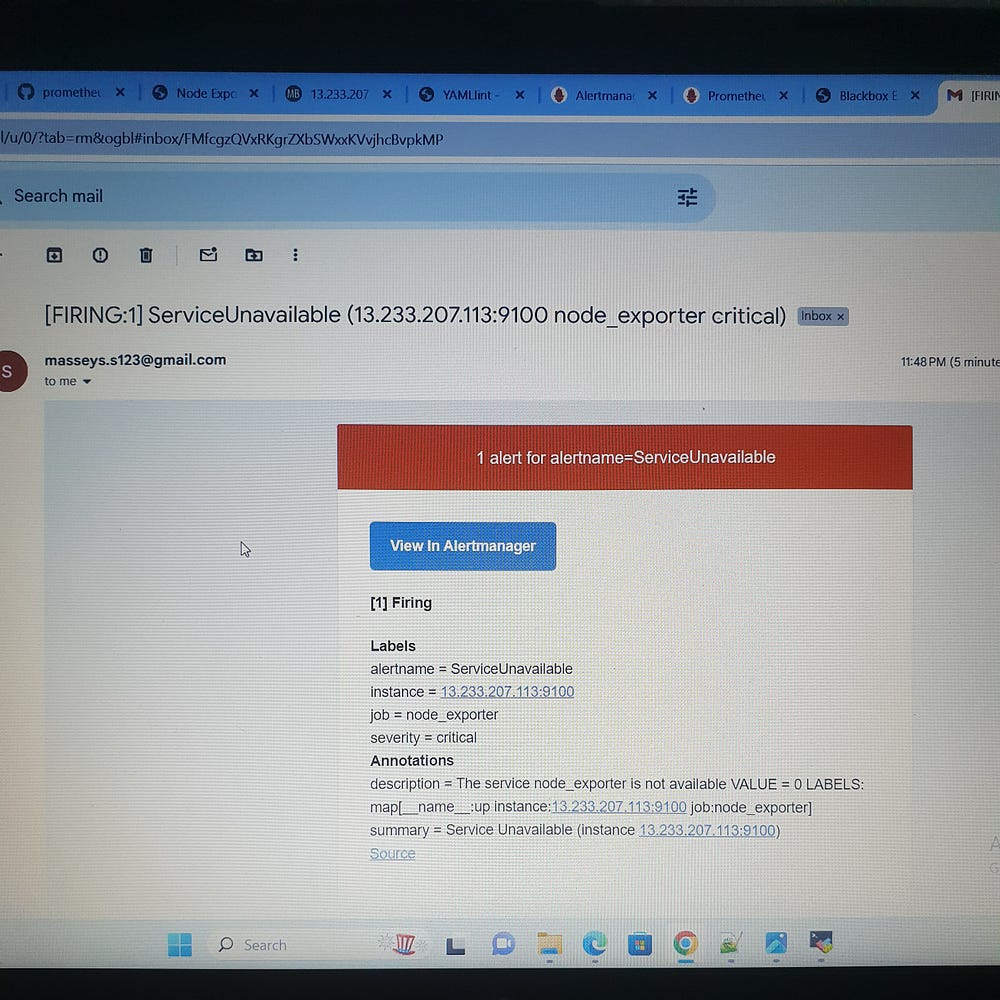
This comprehensive setup ensures high reliability and availability, enabling proactive management and quick response to potential issues, thus maintaining optimal system performance and service availability.